Covid-19
Last Updated: 19-Feb-2022
Overview
Covid-19 infections took off in the US starting in about April, 2020. Because
many of the deaths attributed to Covid-19 were in people who were old or
had other co-morbidities (or both) a reasonable question would be:
How many of these deaths were caused by Covid as opposed to deaths
caused by multiple factors with Covid merely being one factor?
Another question might be:
Is Covid just a bad flu?
Both of these questions can be tentatively answered by ignoring the classification
of cause of death and simply looking at the total number of deaths.
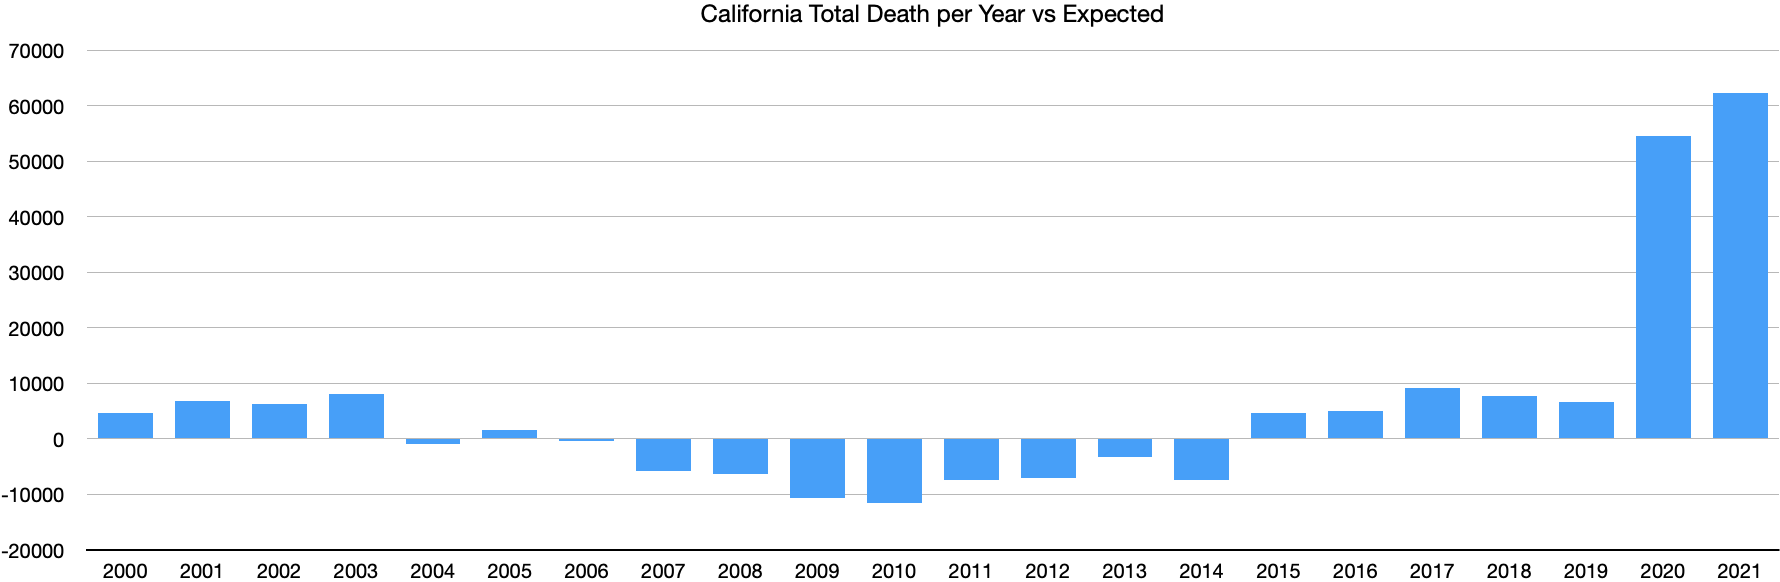
California provides 'total death' data by both month and year and we can look at
"excess" deaths compared to expected or typical deaths in any month or year. Doing so results in
the following two charts:
and:
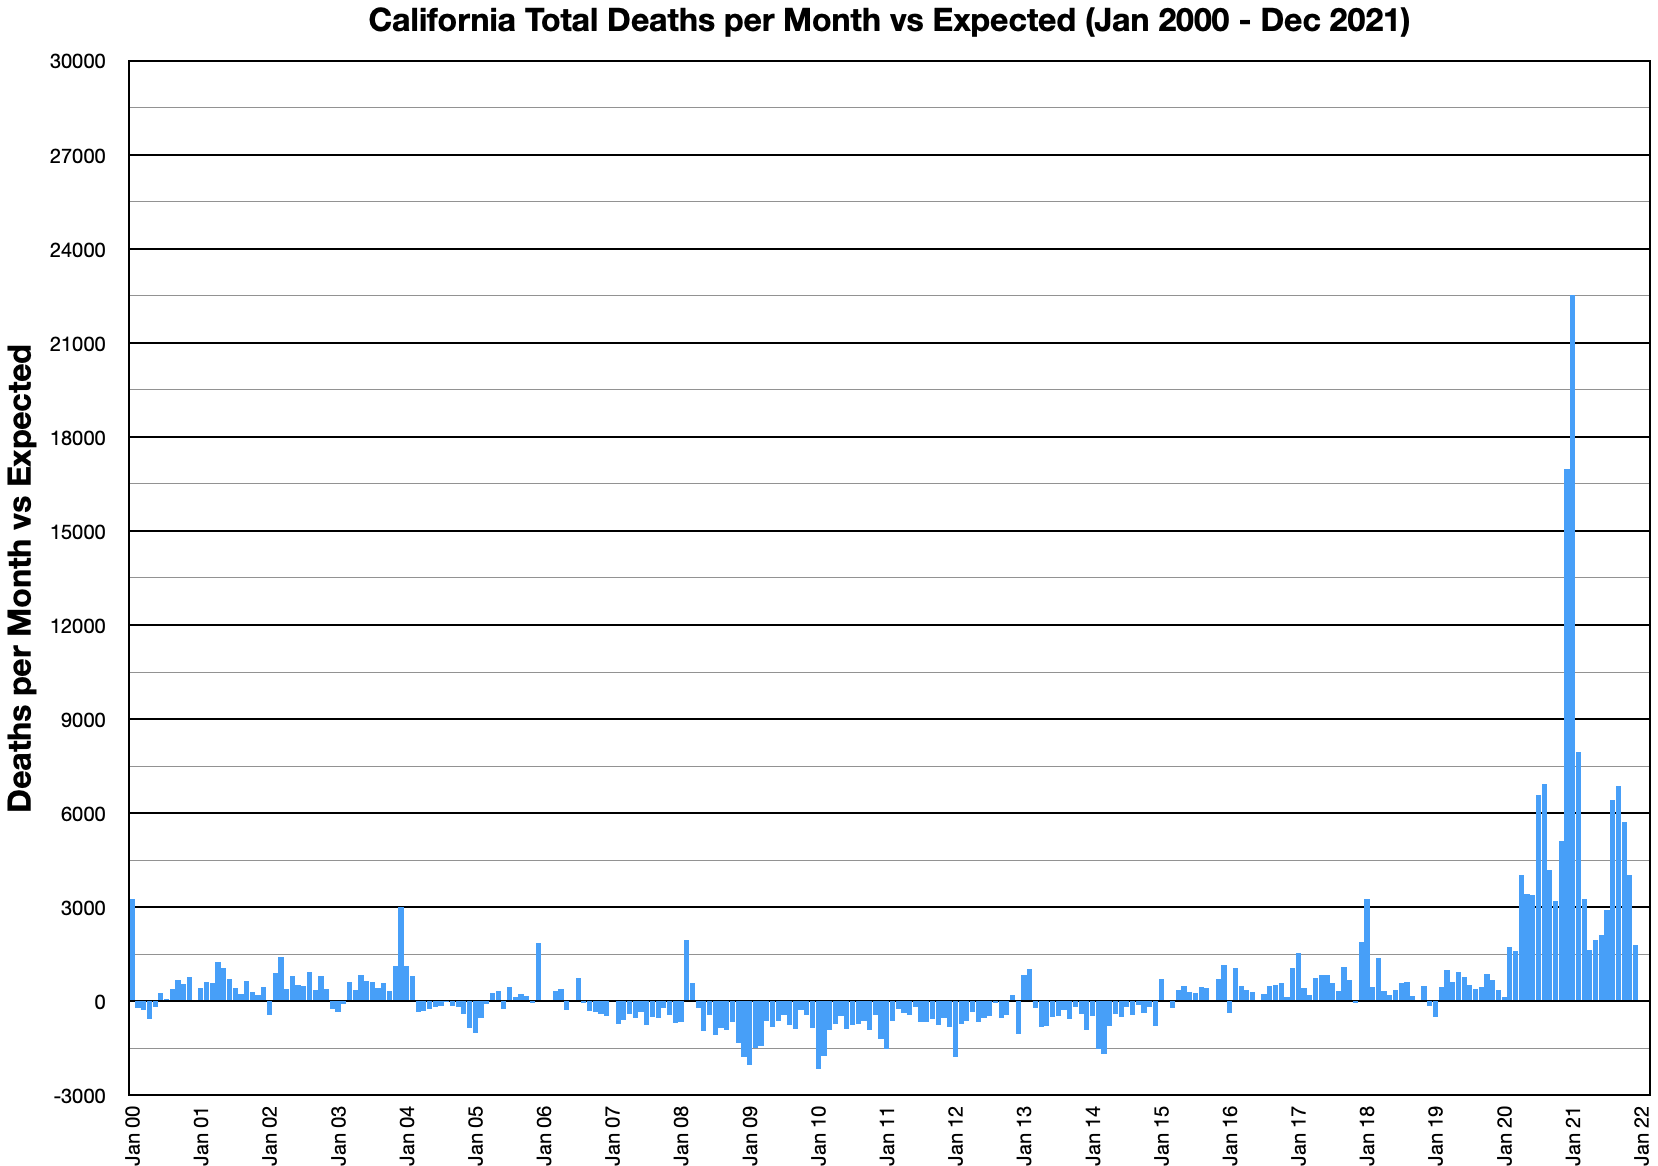
It is obvious that something unusual happened starting in April, 2020.
We can, in fact, make two fairly confident assertions:
- Covid-19 was not just a bad flu season. Examples of bad flu seasons
as reported at the time include winter 1999-2000 (as seen by the monthly spike
in January, 20000) and winter 20003-4. The statistics can't provide
a cause for the increase in deaths starting in April of 2020 (maybe it
was Fentanyl overdoses ...), but the actual deaths compared to expected
deaths was much worse than even bad flu seasons in the past 20 years.
- The total "excess" deaths roughly matches the reported Covid deaths.
California reported around 50,000 Covid deaths in 2021 and
saw a bit under total 55,000 deaths above those expected by the model.
Again, the model can't reveal the cause of these excess deaths, but
it is reasonable to assume that either Covid or the effects of the
lockdown to fight Covid are responsible. Since the Covid death
numbers are similar to the deaths over expected it is reasonable to
conclude that the bulk of these deaths were basically caused by
Covid. In short, the reported Covid deaths are likely fairly correct.
Details of Analysis
The basic approach was to use the raw data from 2000-2019 to construct a (simple) model
for expected deaths per month. Then compare the model to the actual deaths and see how
much (and in which direction) each month differed from the model.
Raw Death Totals by Month
California total deaths by month without any classification (e.g. age, sex, race, cause) are:
California Raw Death Total By Month
|
2000 |
2001 |
2002 |
2003 |
2004 |
2005 |
2006 |
2007 |
2008 |
2009 |
2010 |
2011 |
2012 |
2013 |
2014 |
2015 |
2016 |
2017 |
2018 |
2019 |
2020 |
2021 |
| January |
24530 |
21911 |
21288 |
21581 |
23295 |
21382 |
22661 |
22847 |
22385 |
21231 |
21328 |
22206 |
22171 |
25006 |
23896 |
25315 |
24445 |
26585 |
28546 |
24992 |
25764 |
48156 |
| February |
18809 |
19819 |
20306 |
19493 |
20533 |
19373 |
20084 |
19550 |
22388 |
19120 |
19038 |
20343 |
20417 |
22359 |
19988 |
21714 |
22919 |
22470 |
22649 |
22832 |
23828 |
30038 |
| March |
20022 |
21062 |
22079 |
21483 |
20691 |
21150 |
21728 |
20996 |
22336 |
20517 |
21221 |
22079 |
21880 |
22475 |
21191 |
22810 |
23718 |
23596 |
24979 |
24767 |
25123 |
26778 |
| April |
18207 |
20185 |
19480 |
19606 |
19087 |
19823 |
20096 |
19464 |
19813 |
19536 |
19603 |
20122 |
20302 |
19968 |
20159 |
21452 |
21631 |
22149 |
21901 |
22348 |
25626 |
23257 |
| May |
18557 |
19944 |
19832 |
20010 |
19089 |
19814 |
19348 |
19213 |
18946 |
19222 |
19720 |
19912 |
19829 |
19847 |
20376 |
21405 |
21364 |
22031 |
21567 |
22432 |
24942 |
23470 |
| June |
17771 |
18397 |
18357 |
18641 |
17992 |
18094 |
18505 |
18327 |
18398 |
18395 |
18306 |
19182 |
19005 |
19190 |
19356 |
20337 |
20245 |
21191 |
20907 |
21483 |
23991 |
22698 |
| July |
18082 |
18579 |
18801 |
19091 |
18459 |
19231 |
19647 |
18300 |
18140 |
18907 |
18753 |
18978 |
19325 |
19469 |
19934 |
20513 |
20647 |
21122 |
21271 |
21358 |
27375 |
23711 |
| August |
18360 |
18332 |
19192 |
18811 |
18497 |
18825 |
18751 |
18445 |
18242 |
18491 |
18653 |
18874 |
19602 |
19543 |
19510 |
20556 |
20736 |
20707 |
21135 |
21047 |
27541 |
27045 |
| September |
17884 |
18010 |
17888 |
18281 |
17699 |
18249 |
17876 |
17800 |
17602 |
17789 |
18201 |
18416 |
18609 |
18752 |
19363 |
20066 |
20325 |
21064 |
20309 |
20739 |
24498 |
27186 |
| October |
18732 |
18643 |
19337 |
19014 |
18669 |
19215 |
18868 |
19161 |
18894 |
19443 |
18999 |
19308 |
19797 |
20223 |
20221 |
20811 |
21521 |
21796 |
21311 |
22339 |
24547 |
27038 |
| November |
19022 |
18615 |
18971 |
19880 |
18535 |
19052 |
18882 |
19027 |
18318 |
19387 |
19538 |
19616 |
20546 |
20101 |
20502 |
21563 |
21173 |
21168 |
21887 |
22241 |
26531 |
25443 |
| December |
20529 |
21186 |
20649 |
24086 |
20412 |
23318 |
21158 |
21135 |
20219 |
21344 |
21150 |
21740 |
21694 |
21984 |
22312 |
24445 |
24518 |
25530 |
23667 |
24374 |
41127 |
25938 |
Raw data from here:
https://data.chhs.ca.gov/dataset/statewide-death-profiles
A few things to note about the death totals by month for years 2000 - 2019:
- Each month of the year has a different 'typical' death count. December
and January tend to have more deaths than other months. June - September
tend to have the lowest typical death counts. Broadly, more people die during the winter
months than other months. Fewer people die in summer.
- Different months have different year-to-year variation:
2000-2019 Monthly Min and Max Death Counts (ordered by Max)
| Month | Min | Max |
|---|
| January | 21231 | 28546 |
| December | 20219 | 25530 |
| March | 20022 | 24979 |
| February | 18809 | 22919 |
| May | 18557 | 22432 |
| April | 18207 | 22348 |
| October | 18643 | 22339 |
| November | 18318 | 22241 |
| June | 17771 | 21483 |
| July | 18082 | 21358 |
| August | 18242 | 21135 |
| September | 17602 | 21064 |
Note that the 2000-2019 highest death total for August and September are
lower than the lowest death total for January!
- The typical death rates climb from 2000 to 2019. This is not surprising
because California's population was rising at the same time.
Build a Model
We can build a very simple model to predict monthly deaths by fitting
a straight line for the yearly data for each month for the years 2000 - 2019.
This results in equations for 12 lines — one for every month in the
year — and the appropriate equations can then be evaluated to
get an 'expected' death count for every month in every year.
The model generated 'expected' death counts look like this:
Model Raw Death Total By Month
|
2000 |
2001 |
2002 |
2003 |
2004 |
2005 |
2006 |
2007 |
2008 |
2009 |
2010 |
2011 |
2012 |
2013 |
2014 |
2015 |
2016 |
2017 |
2018 |
2019 |
2020 |
2021 |
|---|
| January |
21268 |
21490 |
21713 |
21935 |
22157 |
22380 |
22602 |
22824 |
23047 |
23269 |
23491 |
23714 |
23936 |
24158 |
24381 |
24603 |
24825 |
25048 |
25270 |
25492 |
25715 |
25937 |
| February |
19038 |
19214 |
19390 |
19566 |
19742 |
19918 |
20094 |
20270 |
20446 |
20622 |
20798 |
20974 |
21150 |
21326 |
21502 |
21678 |
21854 |
22030 |
22206 |
22382 |
22558 |
22734 |
| March |
20312 |
20494 |
20675 |
20857 |
21039 |
21221 |
21403 |
21584 |
21766 |
21948 |
22130 |
22312 |
22494 |
22675 |
22857 |
23039 |
23221 |
23403 |
23584 |
23766 |
23948 |
24130 |
| April |
18764 |
18920 |
19076 |
19232 |
19388 |
19544 |
19700 |
19856 |
20013 |
20169 |
20325 |
20481 |
20637 |
20793 |
20949 |
21105 |
21261 |
21417 |
21573 |
21729 |
21885 |
22041 |
| May |
18749 |
18894 |
19038 |
19183 |
19328 |
19472 |
19617 |
19761 |
19906 |
20051 |
20195 |
20340 |
20484 |
20629 |
20774 |
20918 |
21063 |
21207 |
21352 |
21497 |
21641 |
21786 |
| June |
17503 |
17671 |
17840 |
18008 |
18177 |
18346 |
18514 |
18683 |
18851 |
19020 |
19188 |
19357 |
19525 |
19694 |
19862 |
20031 |
20199 |
20368 |
20537 |
20705 |
20874 |
21042 |
| July |
18015 |
18164 |
18313 |
18462 |
18611 |
18760 |
18909 |
19058 |
19207 |
19356 |
19505 |
19654 |
19803 |
19952 |
20101 |
20250 |
20399 |
20548 |
20697 |
20846 |
20995 |
21144 |
| August |
17968 |
18110 |
18252 |
18393 |
18535 |
18677 |
18819 |
18961 |
19103 |
19245 |
19386 |
19528 |
19670 |
19812 |
19954 |
20096 |
20237 |
20379 |
20521 |
20663 |
20805 |
20947 |
| September |
17199 |
17362 |
17524 |
17687 |
17850 |
18013 |
18176 |
18339 |
18502 |
18665 |
18828 |
18990 |
19153 |
19316 |
19479 |
19642 |
19805 |
19968 |
20131 |
20293 |
20456 |
20619 |
| October |
18176 |
18349 |
18521 |
18694 |
18866 |
19039 |
19211 |
19384 |
19556 |
19729 |
19901 |
20074 |
20246 |
20419 |
20591 |
20764 |
20936 |
21109 |
21281 |
21454 |
21627 |
21799 |
| November |
18236 |
18412 |
18587 |
18762 |
18937 |
19113 |
19288 |
19463 |
19638 |
19814 |
19989 |
20164 |
20339 |
20515 |
20690 |
20865 |
21040 |
21216 |
21391 |
21566 |
21741 |
21917 |
| December |
20542 |
20724 |
20906 |
21088 |
21270 |
21453 |
21635 |
21817 |
21999 |
22181 |
22364 |
22546 |
22728 |
22910 |
23092 |
23275 |
23457 |
23639 |
23821 |
24003 |
24186 |
24368 |
Compare Model to Actual
The next step is to compare the model expected death totals to the actual death
totals.
(Actual - Model) Death Total By Month
|
2000 |
2001 |
2002 |
2003 |
2004 |
2005 |
2006 |
2007 |
2008 |
2009 |
2010 |
2011 |
2012 |
2013 |
2014 |
2015 |
2016 |
2017 |
2018 |
2019 |
2020 |
2021 |
|---|
| January |
3262 |
421 |
-425 |
-354 |
1138 |
-998 |
59 |
23 |
-662 |
-2038 |
-2163 |
-1508 |
-1765 |
848 |
-485 |
712 |
-380 |
1537 |
3276 |
-500 |
49 |
22219 |
| February |
-229 |
605 |
916 |
-73 |
791 |
-545 |
-10 |
-720 |
1942 |
-1502 |
-1760 |
-631 |
-733 |
1033 |
-1514 |
36 |
1065 |
440 |
443 |
450 |
1270 |
7304 |
| March |
-290 |
568 |
1404 |
626 |
-348 |
-71 |
325 |
-588 |
570 |
-1431 |
-909 |
-233 |
-614 |
-200 |
-1666 |
-229 |
497 |
193 |
1395 |
1001 |
1175 |
2648 |
| April |
-557 |
1265 |
404 |
374 |
-301 |
279 |
396 |
-392 |
-200 |
-633 |
-722 |
-359 |
-335 |
-825 |
-790 |
347 |
370 |
732 |
328 |
619 |
3741 |
1216 |
| May |
-192 |
1050 |
794 |
827 |
-239 |
342 |
-269 |
-548 |
-960 |
-829 |
-475 |
-428 |
-655 |
-782 |
-398 |
487 |
301 |
824 |
215 |
935 |
3301 |
1684 |
| June |
268 |
726 |
517 |
633 |
-185 |
-252 |
-9 |
-356 |
-453 |
-625 |
-882 |
-175 |
-520 |
-504 |
-506 |
306 |
46 |
823 |
370 |
778 |
3117 |
1656 |
| July |
67 |
415 |
488 |
629 |
-152 |
471 |
738 |
-758 |
-1067 |
-449 |
-752 |
-676 |
-478 |
-483 |
-167 |
263 |
248 |
574 |
574 |
512 |
6380 |
2567 |
| August |
392 |
222 |
940 |
418 |
-38 |
148 |
-68 |
-516 |
-861 |
-754 |
-733 |
-654 |
-68 |
-269 |
-444 |
460 |
499 |
328 |
614 |
384 |
6736 |
6098 |
| September |
685 |
648 |
364 |
594 |
-151 |
236 |
-300 |
-539 |
-900 |
-876 |
-627 |
-574 |
-544 |
-564 |
-116 |
424 |
520 |
1096 |
178 |
446 |
4042 |
6567 |
| October |
556 |
294 |
816 |
320 |
-197 |
176 |
-343 |
-223 |
-662 |
-286 |
-902 |
-766 |
-449 |
-196 |
-370 |
47 |
585 |
687 |
30 |
885 |
2920 |
5239 |
| November |
786 |
203 |
384 |
1118 |
-402 |
-61 |
-406 |
-436 |
-1320 |
-427 |
-451 |
-548 |
207 |
-414 |
-188 |
698 |
133 |
-48 |
496 |
675 |
4790 |
3526 |
| December |
-13 |
462 |
-257 |
2998 |
-858 |
1865 |
-477 |
-682 |
-1780 |
-837 |
-1214 |
-806 |
-1034 |
-926 |
-780 |
1170 |
1061 |
1891 |
-154 |
371 |
16941 |
1570 |
For 2000 - 2019 the model seems to be doing a reasonable job. Most
actual monthly death totals are within ±1,000 deaths (or ± 5%) of
the total predicted by the model. The biggest exceptions (e.g. January 2000) are in months
that were reported at the time to be exceptionally bad flu seasons. For
example, from January, 2000 we have this:
This year's wave of influenza has become widespread across the nation, overwhelming
emergency rooms in cities from Boston to Los Angeles, filling hospital beds and
forcing postponements of operations as staff members turn to treating the rising
number of flu patients.
— New York Times, Jan 8, 2000
and:
Looking back on the 2003-04 influenza season, federal health officials say it was
rougher than the previous three seasons but not unusual for years when the predominant
flu virus is A(H3N2).
—CIDRAP News, Apr 08, 2004
The 2009-2010 swine flu pandemic doesn't show up in the actual death data. This is
not surprising because in spite of the media coverage, it was relatively mild in the
US (less than 3,500 deaths attributed to the swine flu; less than 700 in California
and that 700 was spread over a year).
We don't expect a simple linear model to predict random bad flu seasons, so we can
be reasonably happy with our model. It isn't too bad for normal years and bad flu
seasons stand out.
Model vs Actual T-Scores
Because some months (e.g. December, January, February) have more year-to-year
variation we want to look at how far from the model a given month is TAKING
INTO ACCOUNT the expected variation. T-scores do this and t-scores for
the difference between the real deaths and the model predicted deaths are:
|
2000 |
2001 |
2002 |
2003 |
2004 |
2005 |
2006 |
2007 |
2008 |
2009 |
2010 |
2011 |
2012 |
2013 |
2014 |
2015 |
2016 |
2017 |
2018 |
2019 |
2020 |
2021 |
| January |
2.17 |
0.28 |
-0.28 |
-0.24 |
0.76 |
-0.66 |
0.04 |
0.02 |
-0.44 |
-1.35 |
-1.44 |
-1.00 |
-1.17 |
0.56 |
-0.32 |
0.47 |
-0.25 |
1.02 |
2.18 |
-0.33 |
0.03 |
14.76 |
| February |
-0.24 |
0.62 |
0.94 |
-0.08 |
0.82 |
-0.56 |
-0.01 |
-0.74 |
2.00 |
-1.55 |
-1.82 |
-0.65 |
-0.76 |
1.07 |
-1.56 |
0.04 |
1.10 |
0.45 |
0.46 |
0.46 |
1.31 |
7.53 |
| March |
-0.35 |
0.69 |
1.69 |
0.75 |
-0.42 |
-0.09 |
0.39 |
-0.71 |
0.69 |
-1.73 |
-1.10 |
-0.28 |
-0.74 |
-0.24 |
-2.01 |
-0.28 |
0.60 |
0.23 |
1.68 |
1.21 |
1.42 |
3.19 |
| April |
-0.95 |
2.17 |
0.69 |
0.64 |
-0.52 |
0.48 |
0.68 |
-0.67 |
-0.34 |
-1.08 |
-1.24 |
-0.61 |
-0.57 |
-1.41 |
-1.35 |
0.59 |
0.63 |
1.25 |
0.56 |
1.06 |
6.41 |
2.08 |
| May |
-0.29 |
1.60 |
1.21 |
1.26 |
-0.36 |
0.52 |
-0.41 |
-0.84 |
-1.47 |
-1.27 |
-0.73 |
-0.65 |
-1.00 |
-1.19 |
-0.61 |
0.74 |
0.46 |
1.26 |
0.33 |
1.43 |
5.04 |
2.57 |
| June |
0.51 |
1.39 |
0.99 |
1.21 |
-0.35 |
-0.48 |
-0.02 |
-0.68 |
-0.87 |
-1.20 |
-1.69 |
-0.33 |
-1.00 |
-0.96 |
-0.97 |
0.59 |
0.09 |
1.57 |
0.71 |
1.49 |
5.96 |
3.17 |
| July |
0.12 |
0.73 |
0.86 |
1.11 |
-0.27 |
0.83 |
1.31 |
-1.34 |
-1.89 |
-0.79 |
-1.33 |
-1.19 |
-0.84 |
-0.85 |
-0.30 |
0.46 |
0.44 |
1.01 |
1.01 |
0.90 |
11.28 |
4.54 |
| August |
0.75 |
0.42 |
1.80 |
0.80 |
-0.07 |
0.28 |
-0.13 |
-0.99 |
-1.65 |
-1.44 |
-1.40 |
-1.25 |
-0.13 |
-0.51 |
-0.85 |
0.88 |
0.95 |
0.63 |
1.17 |
0.73 |
12.88 |
11.66 |
| September |
1.16 |
1.10 |
0.61 |
1.00 |
-0.26 |
0.40 |
-0.51 |
-0.91 |
-1.52 |
-1.48 |
-1.06 |
-0.97 |
-0.92 |
-0.95 |
-0.20 |
0.72 |
0.88 |
1.85 |
0.30 |
0.75 |
6.84 |
11.11 |
| October |
1.05 |
0.56 |
1.54 |
0.61 |
-0.37 |
0.33 |
-0.65 |
-0.42 |
-1.25 |
-0.54 |
-1.71 |
-1.45 |
-0.85 |
-0.37 |
-0.70 |
0.09 |
1.11 |
1.30 |
0.06 |
1.68 |
5.53 |
9.92 |
| November |
1.35 |
0.35 |
0.66 |
1.92 |
-0.69 |
-0.10 |
-0.70 |
-0.75 |
-2.26 |
-0.73 |
-0.77 |
-0.94 |
0.35 |
-0.71 |
-0.32 |
1.20 |
0.23 |
-0.08 |
0.85 |
1.16 |
8.21 |
6.05 |
| December |
-0.01 |
0.37 |
-0.21 |
2.43 |
-0.70 |
1.51 |
-0.39 |
-0.55 |
-1.44 |
-0.68 |
-0.98 |
-0.65 |
-0.84 |
-0.75 |
-0.63 |
0.95 |
0.86 |
1.53 |
-0.12 |
0.30 |
13.73 |
1.27 |
T-scores with a magnitude of greater than 2 are noted with a gray backgroud.
If monthly death are 'normally' distributed then we would expect about
one month in 20 to have a t-score greater than 2 or less than -2. For 2000-2019
there were actually fewer than the expected excess values. This is likely because
deaths are correlated — people who die in one month can't die again and people
who don't die get older and are more likely to die in future months.
In any event, it is clear that the deaths per month changed significantly in April
of 2020. This was the single worst month dating back to January of 2000. May
and June were almost as bad and July was substantially worse.
Deaths per month remained substantially above 'expected' until December 2021, which
was still higher than expected but back into the range of high that was within typical
variation.
2020 saw almost 55,000 deaths more than expected. 2021 saw a bit over 60,000
deaths over expected. From 2000 - 2019 the year with the most deaths over expected
was 2017 which saw about 9,000 more than expected.